Myocardial tissue characterization
Feature summary
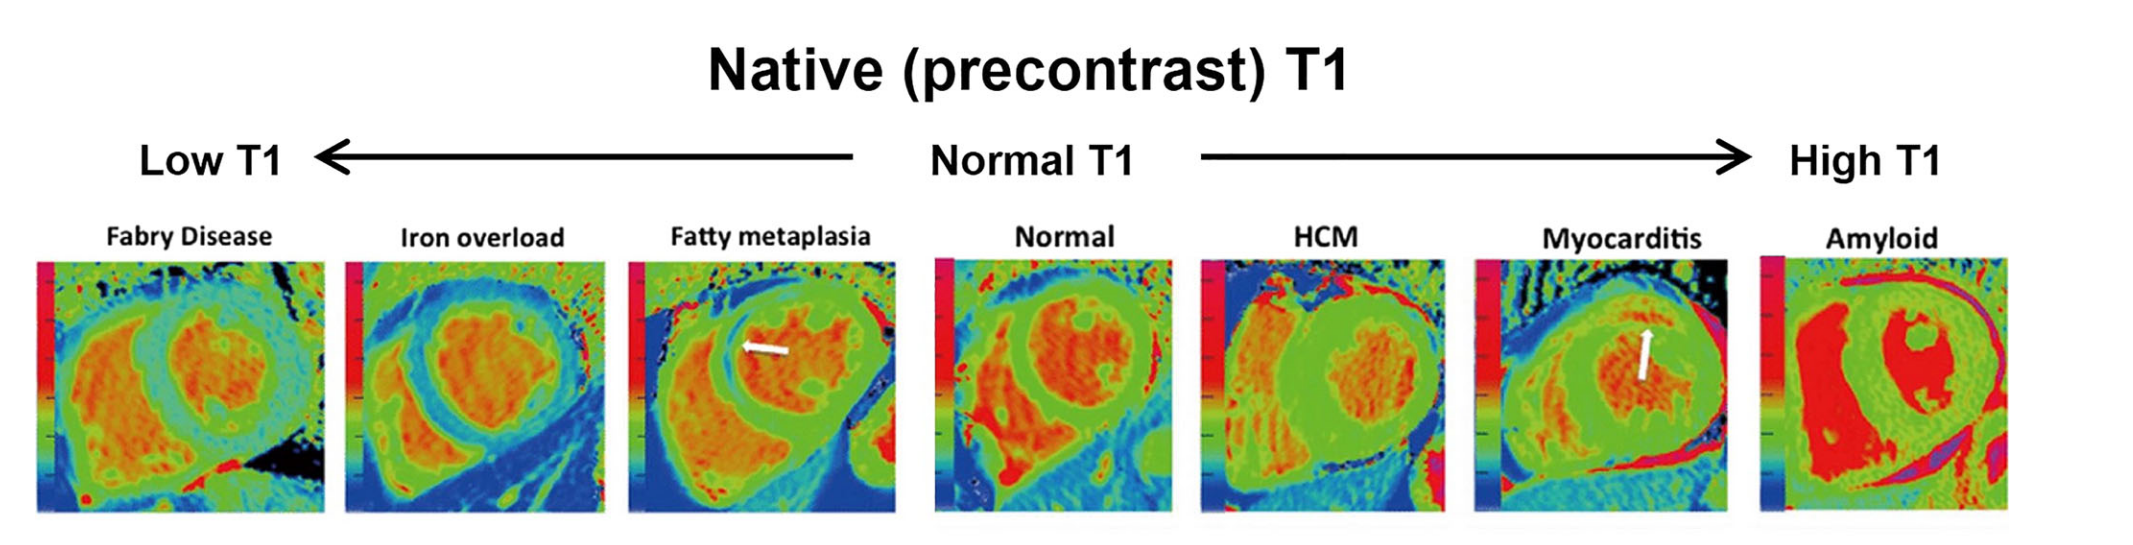
Native myocardial T1
Global, septal, and free-wall myocardial T1 values from the segmented native ShMOLLI T1 map.
Cardiomyopathy (I42)Acute myocarditis (I40)Acute myocardial infarction (I21)Amyloidosis (E85)Fabry disease (E75.2)Disease badges are literature-context navigation only; not diagnoses, CardiacNexus classifiers, or validated phenotype-to-ICD associations.Native blood-pool T1
LV and RV blood-pool T1 values extracted from the same native T1 segmentation.
Cardiomyopathy (I42)Disease badges are literature-context navigation only; not diagnoses, CardiacNexus classifiers, or validated phenotype-to-ICD associations.Blood-corrected native myocardial T1
Cohort-level blood-pool corrected global, septal, and free-wall myocardial T1 values.
Cardiomyopathy (I42)Disease badges are literature-context navigation only; not diagnoses, CardiacNexus classifiers, or validated phenotype-to-ICD associations.Extracellular volume boundary
ECV is described as tissue-characterization context only; it is not emitted by the current native T1 route.
Family: tissueUnit family: %, not current outputSource: Literature context onlyPrimary output group: not current outputHypertrophic cardiomyopathy (I42.2)Disease badges are literature-context navigation only; not diagnoses, CardiacNexus classifiers, or validated phenotype-to-ICD associations.
Myocardial tissue characterization phenotypes summarize native T1 relaxation behavior in myocardium and blood pools. This page is source-audited for the current native_T1.csv and native_T1_corrected.csv output names and explicitly separates current native T1 outputs from ECV, which is not emitted by the current pipeline.
- Modality
- Native T1 mapping
- UKB source
- Data Field 20214
- Pipeline step
- ShMOLLI T1 map QC, myocardial/blood-pool T1 extraction, optional cohort-level blood-pool correction
- Outputs
- native_T1.csv, native_T1_corrected.csv, visualization/ventricle/native_t1.png, visualization/ventricle/native_t1_ivs_fw_blood.png
- Maturity
- Source-audited phenotype page
Clinical question
Native T1 can help characterize diffuse myocardial tissue changes when interpreted with scanner, field strength, sequence, segmentation, and correction context. CardiacNexus reports quantitative T1 values for cohort phenotyping; it does not diagnose myocarditis, infarction, amyloidosis, Fabry disease, cardiomyopathy, or hypertrophic cardiomyopathy from a single row.
Anatomical and physiological definition
Native T1 is the pre-contrast longitudinal relaxation time. In the current CardiacNexus route, the native T1 map is segmented into myocardium, LV blood pool, and RV blood pool. The myocardium is further summarized globally and split into intraventricular septum (IVS) and free wall (FW) by the helper used in the extraction source.
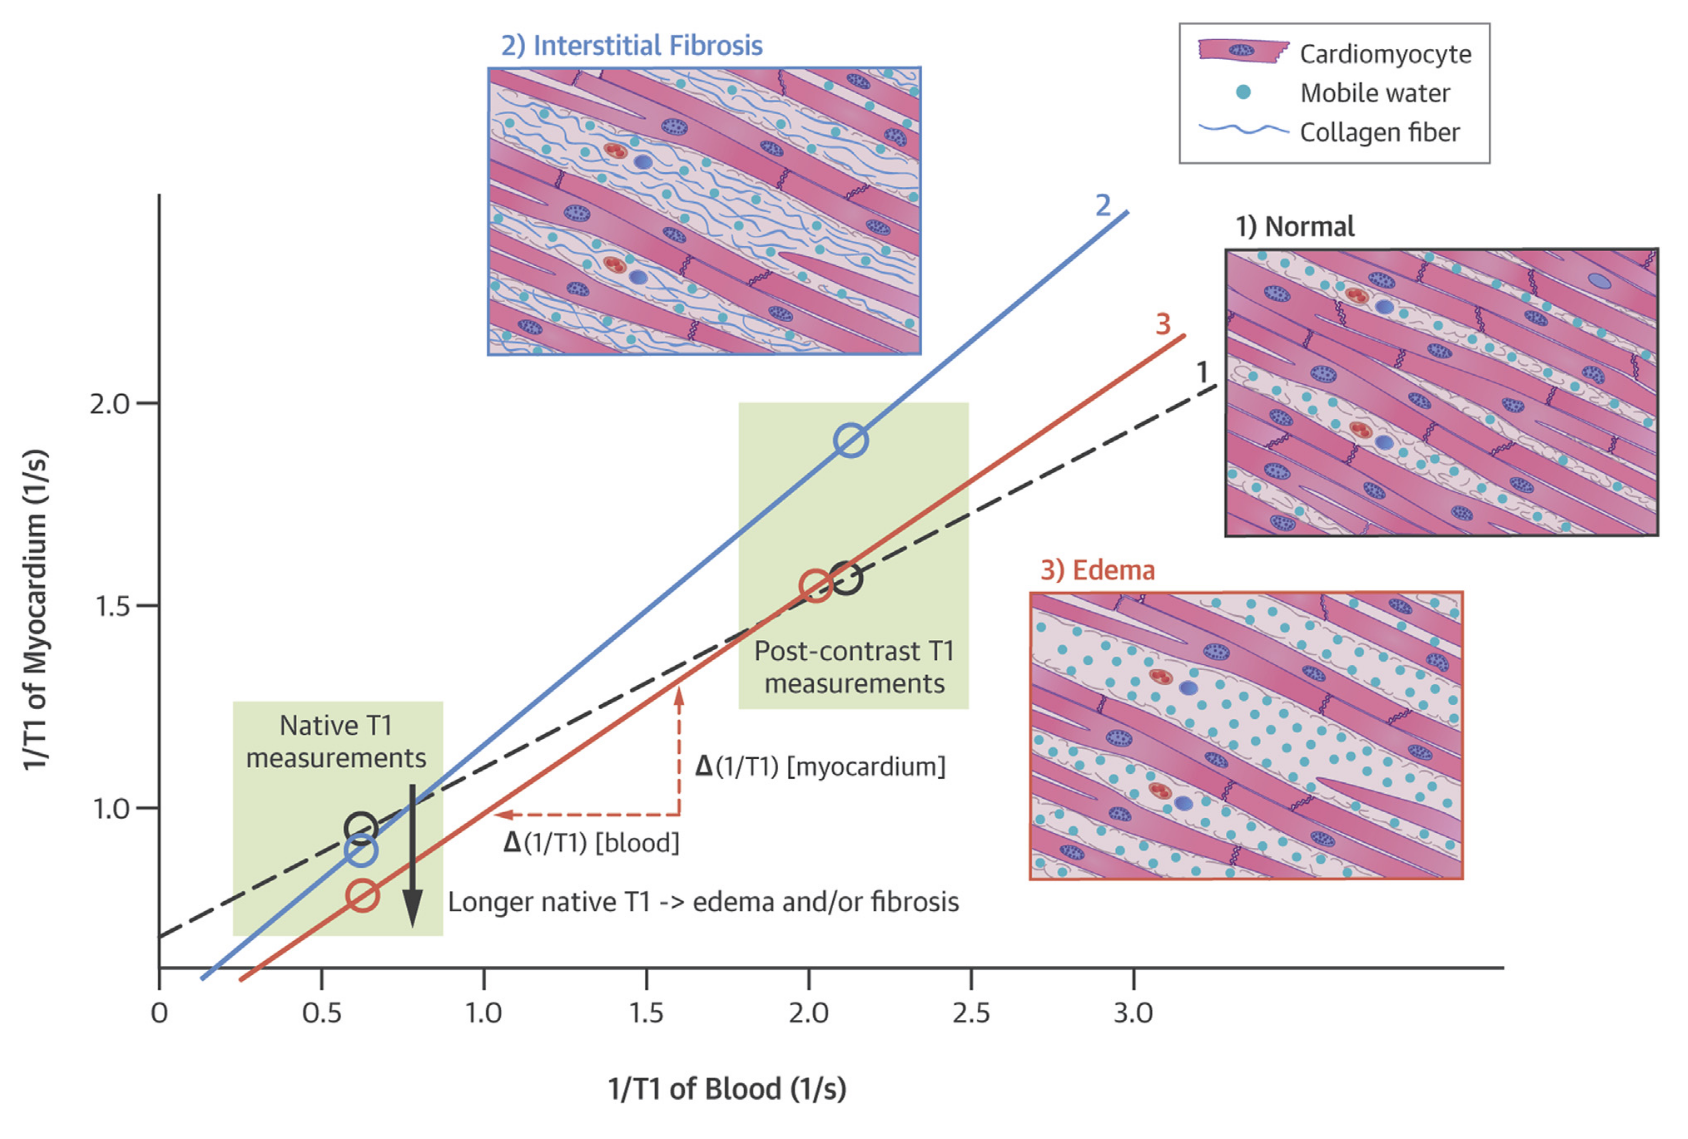
Blood-pool correction is a derived cohort-level adjustment. The correction script first calculates each subject's mean blood-pool T1 from LV and RV blood-pool values, estimates linear relationships between blood-pool T1 and myocardial T1 across the aggregate, and then adjusts each subject's myocardial T1 using the difference between cohort mean blood R1 and subject blood R1 [5].
Source acquisition and UKB field
Native T1 mapping uses UK Biobank Data Field 20214. The current implementation expects shmolli_t1map.nii.gz and seg_shmolli_t1map.nii.gz. Segmentation labels are 1 for myocardium, 2 for LV blood pool, and 3 for RV blood pool.
What exactly CardiacNexus measures
Native myocardial and blood-pool T1
eval_native_t1.py reads the native T1 map and segmentation, checks ShMOLLI segmentation quality, and calls evaluate_t1_uncorrected. It writes global myocardial T1, IVS T1, FW T1, LV blood-pool T1, and RV blood-pool T1 to native_T1.csv.

Blood-pool corrected T1
eval_native_t1_corrected.py reads the aggregated native_T1.csv, drops rows missing required native T1 fields, computes each subject's mean blood-pool T1, fits cohort-level linear regressions between blood-pool T1 and each myocardial T1 family, and writes corrected global, IVS, and FW values to native_T1_corrected.csv.
Extracellular volume boundary
ECV requires pre-contrast T1, post-contrast T1, and hematocrit. Those required inputs and output columns are not part of the current native T1 extraction route, so ECV is documented only as clinical context [6].
Output columns and units
| Display family | Exact output column | Unit | Status | Schema note |
|---|---|---|---|---|
| Native myocardial T1 | Native T1: Myocardium-Global [ms] | ms | current | uncorrected native T1 |
| Native myocardial T1 | Native T1: Myocardium-IVS [ms] | ms | current | intraventricular septum |
| Native myocardial T1 | Native T1: Myocardium-FW [ms] | ms | current | free wall |
| Native blood-pool T1 | Native T1: LV Blood Pool [ms] | ms | current | LV blood-pool label |
| Native blood-pool T1 | Native T1: RV Blood Pool [ms] | ms | current | RV blood-pool label |
| Corrected myocardial T1 | Native T1-Corrected: Myocardium-Global-corrected [ms] | ms | current | cohort-level blood correction |
| Corrected myocardial T1 | Native T1-Corrected: Myocardium-IVS-corrected [ms] | ms | current | cohort-level blood correction |
| Corrected myocardial T1 | Native T1-Corrected: Myocardium-FW-corrected [ms] | ms | current | cohort-level blood correction |
Output reconciliation
| Evidence layer | Result |
|---|---|
| Implementation source | 5 native T1 rows checked against eval_native_t1.py; 3 corrected rows checked against eval_native_t1_corrected.py |
| Output inventory | docs/data/output_column_inventory.yml records native_T1 and native_T1_corrected artifact families |
| Phenotype dictionary | docs/data/phenotype_dictionary.yml links current native and corrected T1 rows to this page |
| Page output table | all current emitted columns are listed above |
Required upstream inputs
shmolli_t1map.nii.gz;seg_shmolli_t1map.nii.gz;- successful
shmolli_pass_quality_controlresult; - aggregated
native_T1.csvfor corrected outputs; - enough non-missing native T1 rows to fit cohort-level correction regressions.
Reference ranges with cohort and method context
| Feature | Source | Cohort | Reference value | Status | Note |
|---|---|---|---|---|---|
| Native myocardial T1 method | T1 mapping review [1] | method review | not a normal range | Verified context source | Definitions and scanner/sequence caveats |
| Automated native T1 quantification | Puyol-Anton et al. [2] | UKB-style automated T1 mapping cohort | source-specific values | Verified context source | Closest automated-method context; exact row extraction deferred |
| ShMOLLI normal variation | Piechnik et al. [3] | healthy 1.5T ShMOLLI cohort | sex-specific source values | Verified context source | Method-dependent; do not mix with other sequences |
| Broad CMR reference update | Kawel-Boehm et al. [4] | consensus reference update | tissue values are context only here | Verified context source | Use as broad CMR context, not as a direct CardiacNexus T1 threshold |
| Blood-pool correction | Nickander et al. [5] | derivation/validation context | correction method context | Verified context source | Supports correction rationale, not a universal threshold |
| ECV | Tissue characterization review [6] | review | not current output | Verified context source | ECV requires contrast and hematocrit; not emitted here |
Source-located registry status: reference_range_sources.yml maps native T1 method context to Taylor 2016, automated native T1 quantification to Puyol-Anton 2020, ShMOLLI normal variation to Piechnik 2013, and blood correction to Nickander 2016. Exact numeric normal rows are not promoted as CardiacNexus thresholds until scanner, field strength, sequence, ROI, correction, and segmentation conventions are source-matched.
Disease interpretation
Native T1 elevation is reported in edema, myocarditis, myocardial infarction, amyloidosis, diffuse fibrosis, hypertrophic cardiomyopathy, dilated cardiomyopathy, and some aortic stenosis/remodeling contexts. Native T1 can be reduced in Fabry disease and iron/lipid-related contexts [1] [6]. These disease badges are navigation/context aids only; method-specific T1 values require scanner, sequence, and correction context.
QC caveats and maturity boundary
Native T1 is highly acquisition-sensitive. Field strength, scanner platform, ShMOLLI implementation, motion, segmentation, partial volume, blood-pool contamination, and correction strategy can change values. Corrected and uncorrected rows should not be pooled without explicit method labels.
The correction route is cohort-dependent because it estimates alpha values from the current aggregate. Changing the cohort, missingness pattern, or aggregate build can change corrected values even when a subject's uncorrected T1 is unchanged.
Implementation provenance
| Feature family | Formula or computational route | Exact output columns | Source code file and function | Upstream dependencies | Conditional behavior | QC artifacts | Schema debt |
|---|---|---|---|---|---|---|---|
| Native myocardial T1 | segmentation QC, then evaluate_t1_uncorrected summaries for global myocardium, IVS, and FW | Native T1: Myocardium-* [ms] rows | eval_native_t1.py; evaluate_t1_uncorrected | ShMOLLI T1 map, ShMOLLI segmentation, label map | subject skipped if image, segmentation, QC, or helper fails | native_t1.png, native_t1_ivs_fw_blood.png | values written as formatted strings in current CSV |
| Native blood-pool T1 | same helper returns LV and RV blood-pool T1 values | Native T1: LV Blood Pool [ms], Native T1: RV Blood Pool [ms] | eval_native_t1.py; evaluate_t1_uncorrected | labels 2 and 3 in segmentation | subject skipped with native T1 failure | same visualization files | blood-pool rows are correction inputs as well as public outputs |
| Corrected native T1 | aggregate-level linear regression on blood-pool T1, then subject correction using blood R1 difference | corrected global, IVS, and FW rows | eval_native_t1_corrected.py | aggregated native_T1.csv, non-missing blood-pool and myocardial rows | subject skipped if native T1 row missing; cohort fit depends on available aggregate | no new subject-level visualization | corrected values are cohort-dependent research outputs |
| ECV boundary | not emitted by the current native T1 route | no current output column | not applicable | post-contrast T1 and hematocrit would be required | literature context only | none | do not add ECV output rows unless the pipeline emits them |
Source audit
- Current native T1 labels, QC requirements, segmentation labels, and visualization paths were checked against
eval_native_t1.py. - Current corrected native T1 labels and cohort-level correction behavior were checked against
eval_native_t1_corrected.py. docs/data/reference_sources.ymlis present and used as the curated reference-source registry for this page.- Textbook context boundary: broad Braunwald/Hurst tissue-characterization concepts were not surfaced as a separate section because page-specific T1 mapping, automated native T1, ShMOLLI, blood correction, and tissue-characterization sources are sufficient for draft rollout.
- Figure provenance is registered in
docs/data/figure_provenance.ymlfor the native T1 region panel; permission and exact source-panel review remain pending for public release, but the figure has complete draft provenance.
Related pages
References
- Taylor AJ, Salerno M, Dharmakumar R, Jerosch-Herold M. T1 Mapping. JACC: Cardiovascular Imaging. 2016;9(1):67-81.
- Puyol-Anton E, Ruijsink B, Baumgartner CF, Masci PG, Sinclair M, Konukoglu E, Razavi R, King AP. Automated Quantification of Myocardial Tissue Characteristics from Native T1 Mapping Using Neural Networks with Uncertainty-Based Quality-Control. Journal of Cardiovascular Magnetic Resonance. 2020;22(1):60.
- Piechnik SK, Ferreira VM, Lewandowski AJ, Ntusi NA, Banerjee R, Holloway C, Hofman MB, Sado DM, Maestrini V, White SK, Lazdam M, Karamitsos T, Moon JC, Neubauer S, Leeson P, Robson MD. Normal Variation of Magnetic Resonance T1 Relaxation Times in the Human Population at 1.5 T Using ShMOLLI. Journal of Cardiovascular Magnetic Resonance. 2013;15(1):13.
- Kawel-Boehm N, Hetzel SJ, Ambale-Venkatesh B, Captur G, Francois CJ, Jerosch-Herold M, Salerno M, Teague SD, Valsangiacomo-Buechel ER, Van Der Geest RJ, Bluemke DA. Reference Ranges for Normal Cardiac Chamber Size and Function Using Cardiovascular Magnetic Resonance. Journal of Cardiovascular Magnetic Resonance. 2020;22(1):87.
- Nickander J, Lundin M, Abdula G, Sorensson P, Rosmini S, Moon JC, Kellman P, Sigfridsson A, Ugander M. Blood Correction Reduces Variability and Gender Differences in Native Myocardial T1 Values at 1.5 T Cardiovascular Magnetic Resonance - a Derivation/Validation Approach. Journal of Cardiovascular Magnetic Resonance. 2016;19(1):41.
- Barison A, Aimo A, Todiere G, Grigoratos C, Aquaro GD, Emdin M. Cardiovascular Magnetic Resonance for the Diagnosis and Management of Heart Failure with Preserved Ejection Fraction. Heart Failure Reviews. 2022;27(1):191-205.